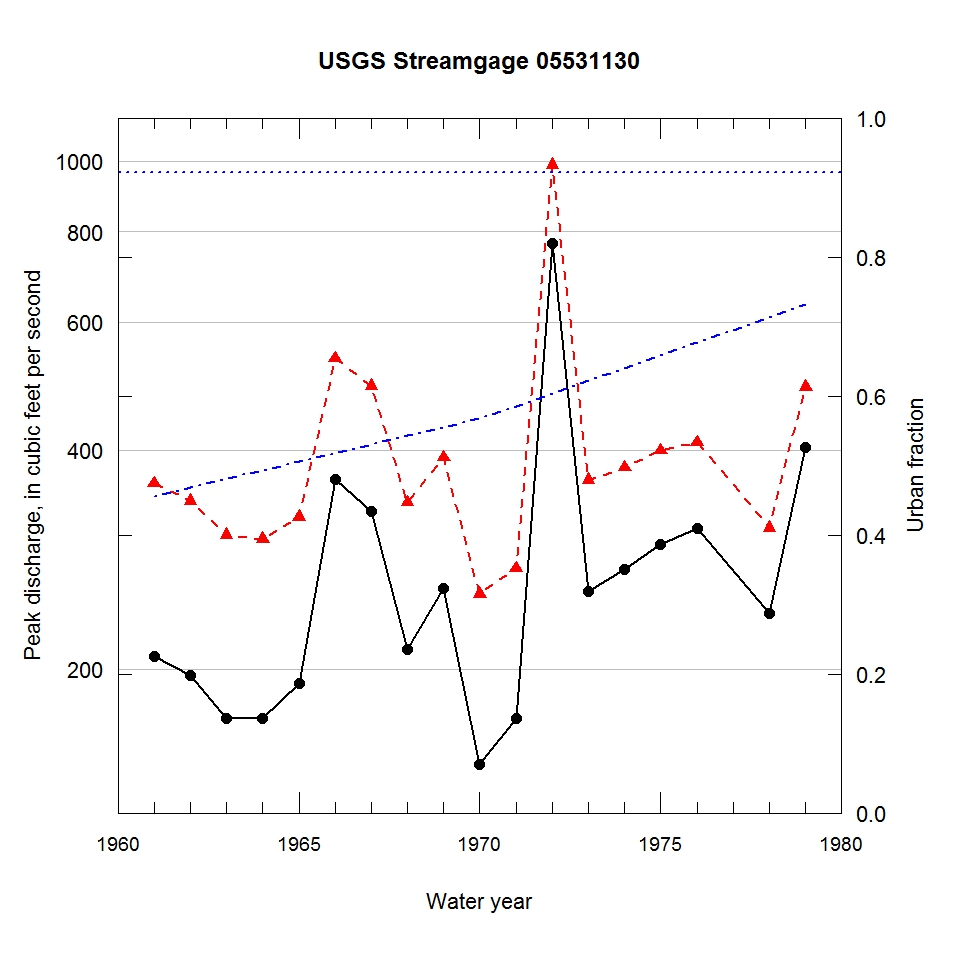
Observed and urbanization-adjusted annual maximum peak discharge and associated urban fraction and precipitation values at USGS streamgage:
05531130 SPRING BROOK AT WALNUT AVE AT ITASCA, IL


| Water year | Segment | Discharge code | Cumulative reservoir storage (acre-feet) | Urban fraction | Precipitation (inches) | Observed peak discharge (ft3/s) | Adjusted peak discharge (ft3/s) | Exceedance probability |
| 1961 | 1 | -- | 359 | 0.456 | 1.455 | 208 | 360 | 0.627 |
| 1962 | 1 | -- | 359 | 0.468 | 0.251 | 196 | 341 | 0.681 |
| 1963 | 1 | 4 | 359 | 0.481 | 1.151 | 171 | 306 | 0.772 |
| 1964 | 1 | 4B | 359 | 0.493 | 0.144 | 171 | 302 | 0.780 |
| 1965 | 1 | -- | 359 | 0.505 | 0.144 | 191 | 324 | 0.728 |
| 1966 | 1 | -- | 359 | 0.518 | 1.355 | 365 | 535 | 0.228 |
| 1967 | 1 | -- | 359 | 0.530 | 1.437 | 330 | 490 | 0.311 |
| 1968 | 1 | -- | 359 | 0.543 | 1.270 | 213 | 339 | 0.687 |
| 1969 | 1 | -- | 359 | 0.555 | 1.298 | 258 | 391 | 0.546 |
| 1970 | 1 | -- | 359 | 0.567 | 1.293 | 148 | 254 | 0.887 |
| 1971 | 1 | 4B | 359 | 0.586 | 0.144 | 171 | 275 | 0.840 |
| 1972 | 1 | -- | 359 | 0.604 | 1.177 | 770 | 987 | 0.026 |
| 1973 | 1 | -- | 359 | 0.622 | 0.805 | 256 | 364 | 0.617 |
| 1974 | 1 | -- | 359 | 0.640 | 0.522 | 274 | 379 | 0.578 |
| 1975 | 1 | -- | 359 | 0.658 | 1.000 | 297 | 400 | 0.526 |
| 1976 | 1 | -- | 359 | 0.677 | 0.964 | 312 | 410 | 0.501 |
| 1978 | 1 | -- | 359 | 0.713 | 1.216 | 239 | 313 | 0.754 |
| 1979 | 1 | -- | 359 | 0.731 | 0.784 | 404 | 489 | 0.309 |

